What does noise figure signifies, Give a calculation example for Receiver chain ?
Noise figure is a number by which the noise performance of an amplifier or a radio receiver can be specified.
Lets start with Signal to Noise Ratio of an amplifier.
Say we feed some signal of power Ps,in to a amplifier. Of course, in addition to signal, there will be some noise at the amplifier input, suppose that to be Pn,in . The output of the amplifier will therefore include both a signal with power out Ps,out, and noise with power out Pn,out.
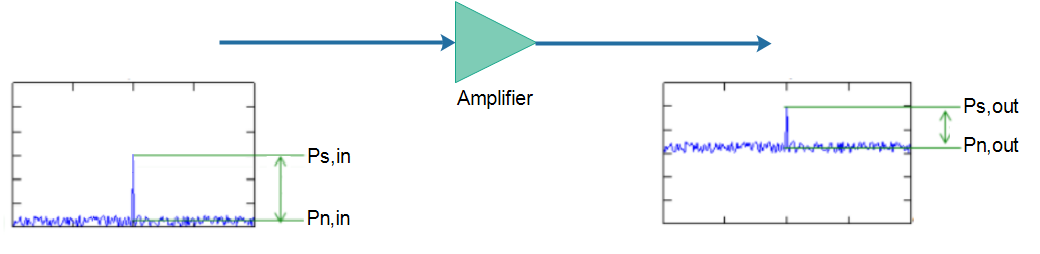
As amplifier has some gain, so signal and the noise at the input get increased at the output.
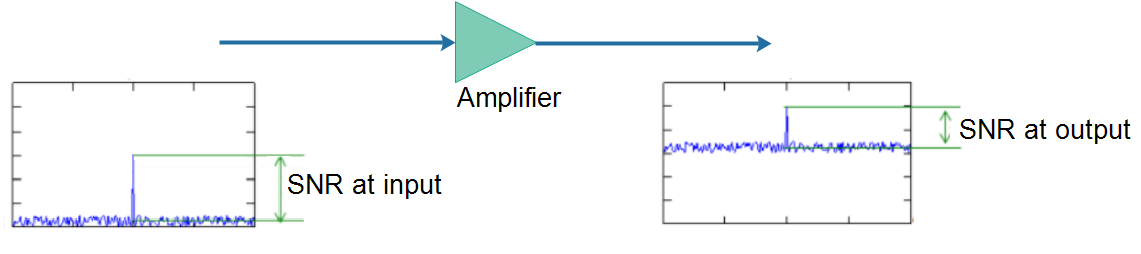
To characterize this system environment, there is a fundamental and important measure in radio systems is the Signal-to-Noise Ratio (SNR).
It is just a ratio of signal power to the noise power.
Here in our system, SNR at input = Ps,in / Pn,in
SNR at output = Ps,out / Pn,out
For an ideal conditions, SNR at the input of an amplifier should be equal to SNR at the output of an amplifier because signal power and noise power, both gets amplified.
But in actual case, the SNR at the output of the amplifier will be less than the SNR at the input.
This is very bad news!
This result means that the SNR will always be degraded as the signal passes through any microwave component!
Now why SNR at the output of amplifier is less, because noise is increased more, as compared to signal power. And this added noise is generated by the amplifier itself. And how much noise is generated by amplifier is characterized in terms of Noise Figure.
In other way, noise levels are increased more by a factor of Noise Figure of that device. Hence, lesser the noise figure, better the device or system.
Noise figure (NF) and noise factor (F) are measures of degradation of the signal-to-noise ratio (SNR), caused by components in a radio-frequency (RF) signal chain. It is a number by which the performance of an amplifier or a radio receiver can be specified, with lower values indicating better performance.
In conclusion, there is an indicator called ‘Noise Factor’ which is defined as the ratio of input SNR and output SNR’ as shown below.

Noise figure is just log scaled value of Noise Factor as shown below.
![]()
NOTE: Always remember, Noise figure is measured in decibel units and Noise factor is in linear units.
Receiver Chain Cascaded Noise Figure example:
Now suppose, there are multiple devices cascaded in the receiver chain and you want to measure the Noise figure of complete Receiver chain.
For example, for the below receiver chain, where the gain (or insertion losses) and noise figure of each device is given from datasheet.
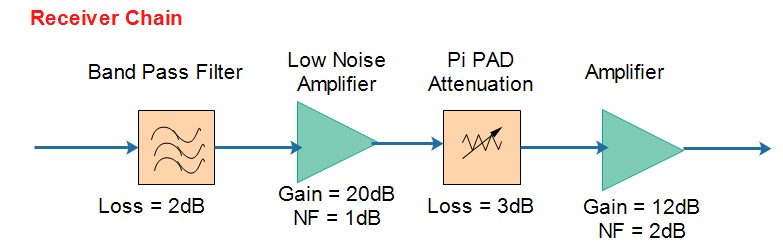
For a passive device like band pass filter, noise figure is equal to the insertion loss of that device.
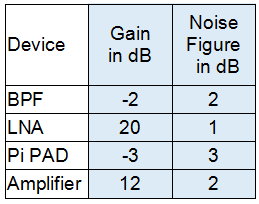
Step 1:
List down the Gain / loss and noise figure of all devices from their respective datasheets.
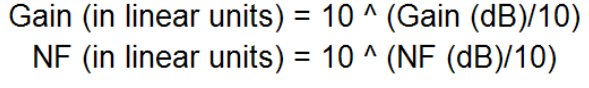
Step 2:
Calculate the given losses, gain or noise figures from decibel to linear units using following formula:

Step 3:
Then apply following cascaded noise figure formula:

Where F = Receiver chain Noise Factor
F1 = Noise Factor of first device
G1 = Gain or loss of first device in linear units
F2 = Noise factor of second device, which is LNA
G2 = Gain of LNA
and so on…
F = 1.58 + (1.26-1)/0.63 + (2-1)/(0.63*100) + (1.58-1)/(0.63*100*0.5)
F = 2.03
Step 4:
After Calculating Noise Factor, convert it to Noise Figure using following formula.
![]()
NF (dB) = 10 * LOG (2.03)
= 3.07
Result:
Noise Figure of above receiver chain = 3.07dB